

- 图表 Panel
- 可定制交互性
图表 Panel
可定制交互性
在之前的入门教程中,我们已经看到了该如何在 GeoMap 面板上定义交互性:当点击地图上的某个点时,地图会自动缩放到该点。
实际上,我们可以为 xObserve 中的很多面板定义交互性,本文档将以 Graph 面板为例,看看如何为面板定义交互性。
本文档将继续使用上一篇文档中创建的面板,并为其添加交互性。
基础点击事件
首先,我们为面板添加一个基础的点击事件,当点击面板时,打印输入的数据。
打开面板编辑器,找到 图表 标签页中的 交互 部分,点击 新增操作 按钮,将 New action 重命名为 Test click:
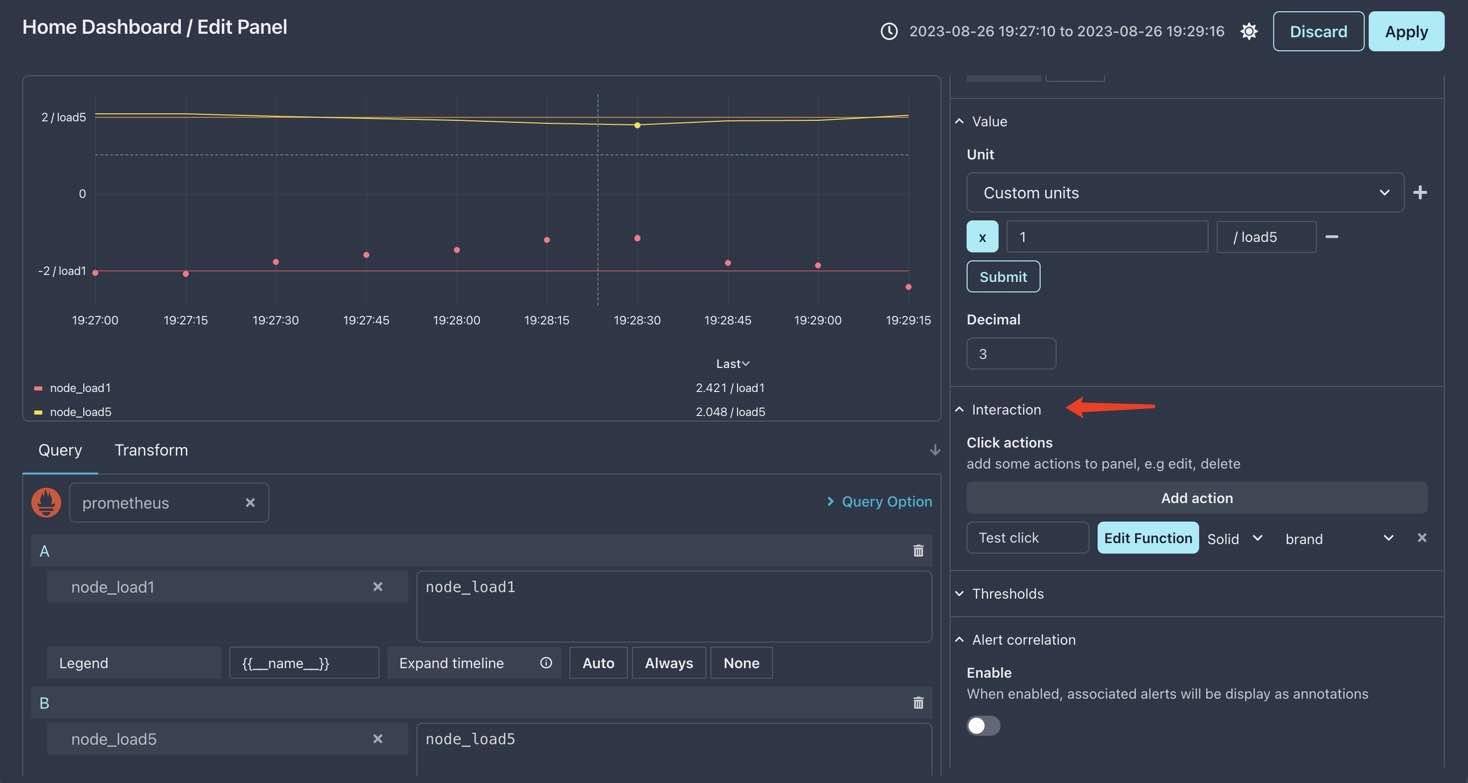
如上图所示,我们创建了一个名为 Test click 的点击操作,现在为其添加一些代码。
点击 编辑函数 按钮,填写如下代码:
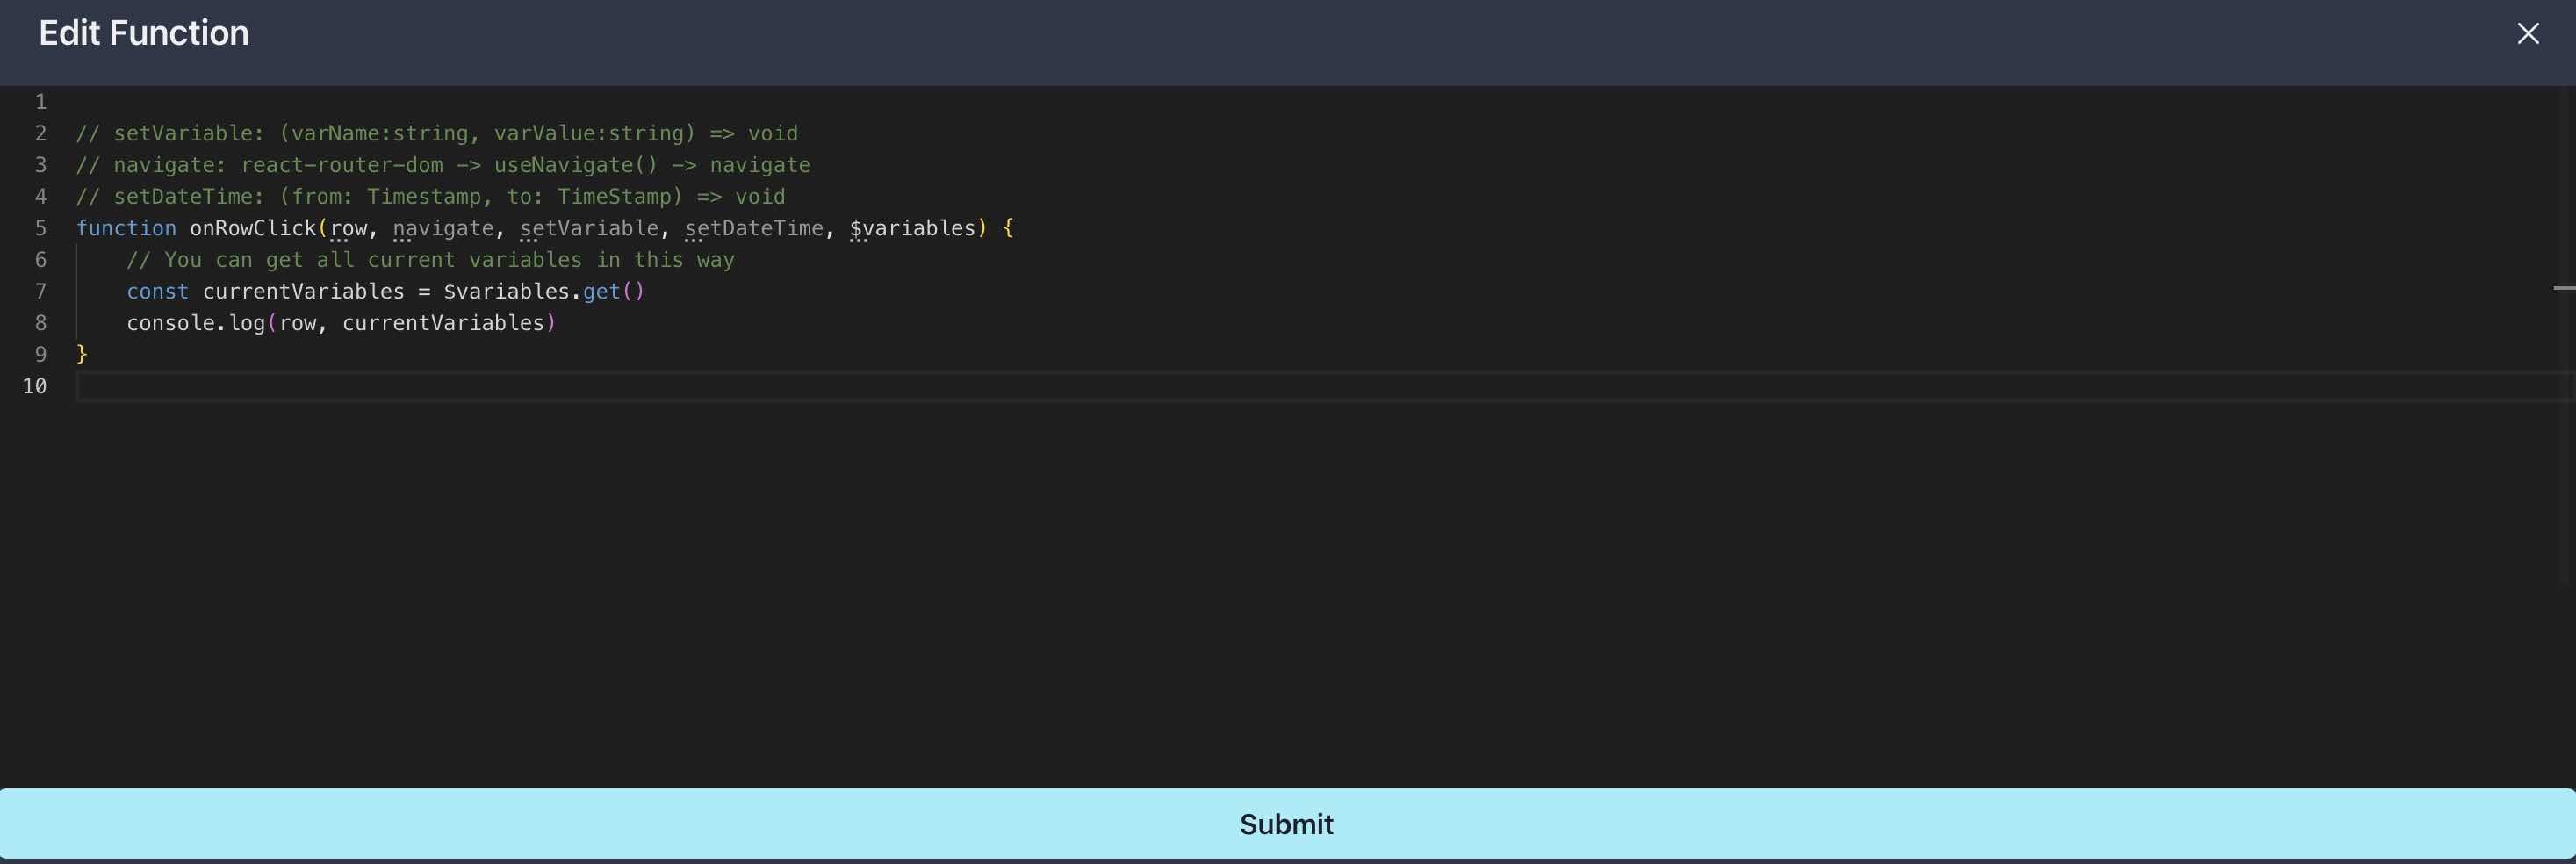
你也可以将下面的代码复制到编辑器中:
// setVariable: (varName:string, varValue:string) => void
// navigate: react-router-dom -> useNavigate() -> navigate
// setDateTime: (from: Timestamp, to: TimeStamp) => void
function onRowClick(row, navigate, setVariable, setDateTime, $variables) {
    // You can get all current variables in this way
    const currentVariables = $variables.get()
    console.log(row, currentVariables)
}
点击 提交 按钮,然后点击 Graph 图表上的任意一处,你应该会看到一个弹出框:
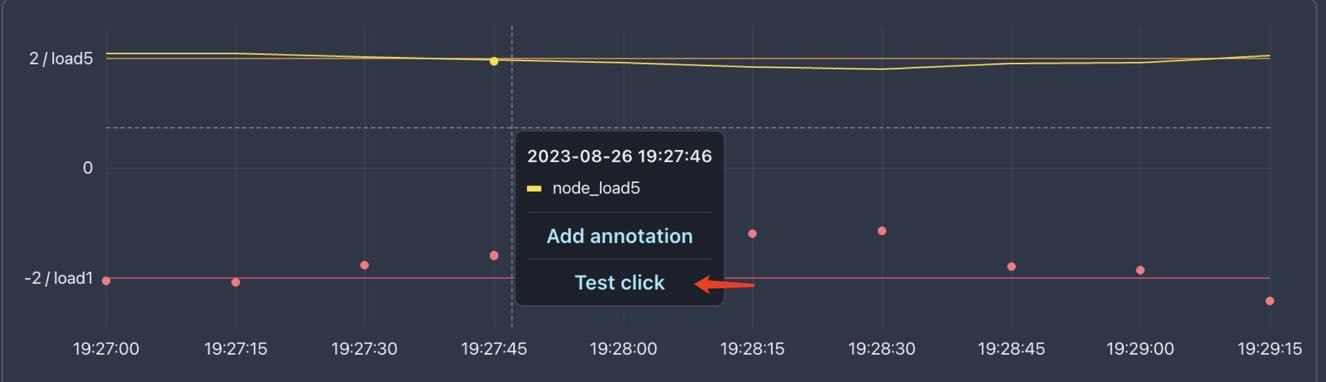
点击 Test click,我们就能在浏览器控制台中看到打印的数据:
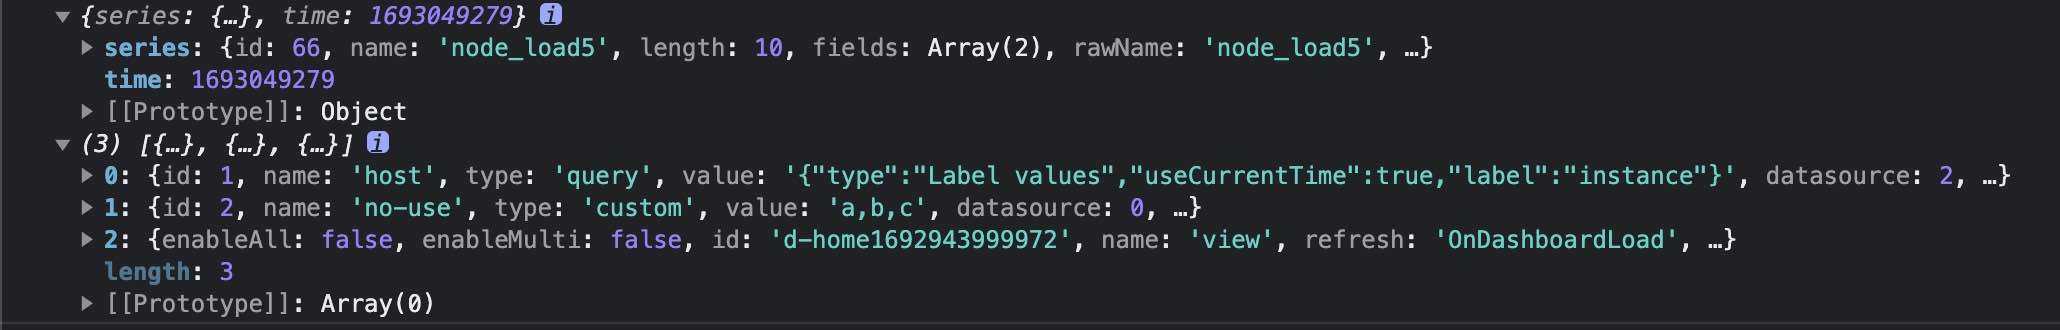
函数参数
如上图所示,事件函数的第一个参数是被点击曲线的数据,它包含了几乎所有你需要的数据。
除了第一个参数,还有一些其他参数,它们也非常重要,让我们一一来看看。
navigate
navigate 是 useNavigate 的返回值,useNavigate 定义在 react-router-dom 中:
import { useNavigate } from "react-router-dom"
const navigate = useNavigate()
navigate 用于导航到其他页面:
navigate("/home")但是,你不能使用 navigate 打开一个新的浏览器标签,如果你想打开一个新的标签,可以使用 window.open:
setVariable
setVariable 用于设置变量的值,同时会将变量的值添加到 url 中,跟你直接选择一个变量的行为一致。
setVariable("host", "localhost:9100")setDateTime
setDateTime 用于设置当前的时间范围,它也会改变 url 中的时间参数。
setDateTime(1693049230, 1693049356)$variables
$variables 中存储了当前的所有变量,你可以通过这种方式获取所有当前的变量:
const currentVariables = $variables.get()进阶点击事件
我们可以使用上面的参数来创建一个更加复杂的点击事件:设置一个变量,以点击点为中心设置新的时间范围,然后跳转到一个 url,这个 url 是从参数数据中获取的。
// setVariable: (varName:string, varValue:string) => void
// navigate: react-router-dom -> useNavigate() -> navigate
// setDateTime: (from: Timestamp, to: TimeStamp) => void
function onRowClick(row, navigate, setVariable, setDateTime, $variables) {
    // get host from clicked series
    const valueField = row.series.fields.find(f => f.labels)
    const host = valueField.labels["instance"]
    if (host) {
        // set timerange to [clickTime - 2m, clickTime + 2m]
        setDateTime(row.time - 120, row.time + 120)

        // set the value of host variable to the new host
        setVariable("host", host)

        // visit host info dashboard to view the new host info
        // wait some time for seting variable complete
        setTimeout(() => {
             navigate("/service/hosts")
        }, 100)
    }
}
将上面的代码复制到编辑器中,在这段代码中:
- 我们从点击的曲线中获取了主机名
- 设置时间范围到点击点前后各 2 分钟
- 将
host变量的值设置为新的主机名 - 导航到
Hosts info仪表盘
这一系列操作跟现实世界的使用非常相似,可以说很具有参考性了:
当你发现一些问题,你会点击这个问题所在的曲线,然后选择问题发生的时间点,最后跳转到一个仪表盘查看更多信息。
这不就是大名鼎鼎的下钻嘛 :D
最终效果
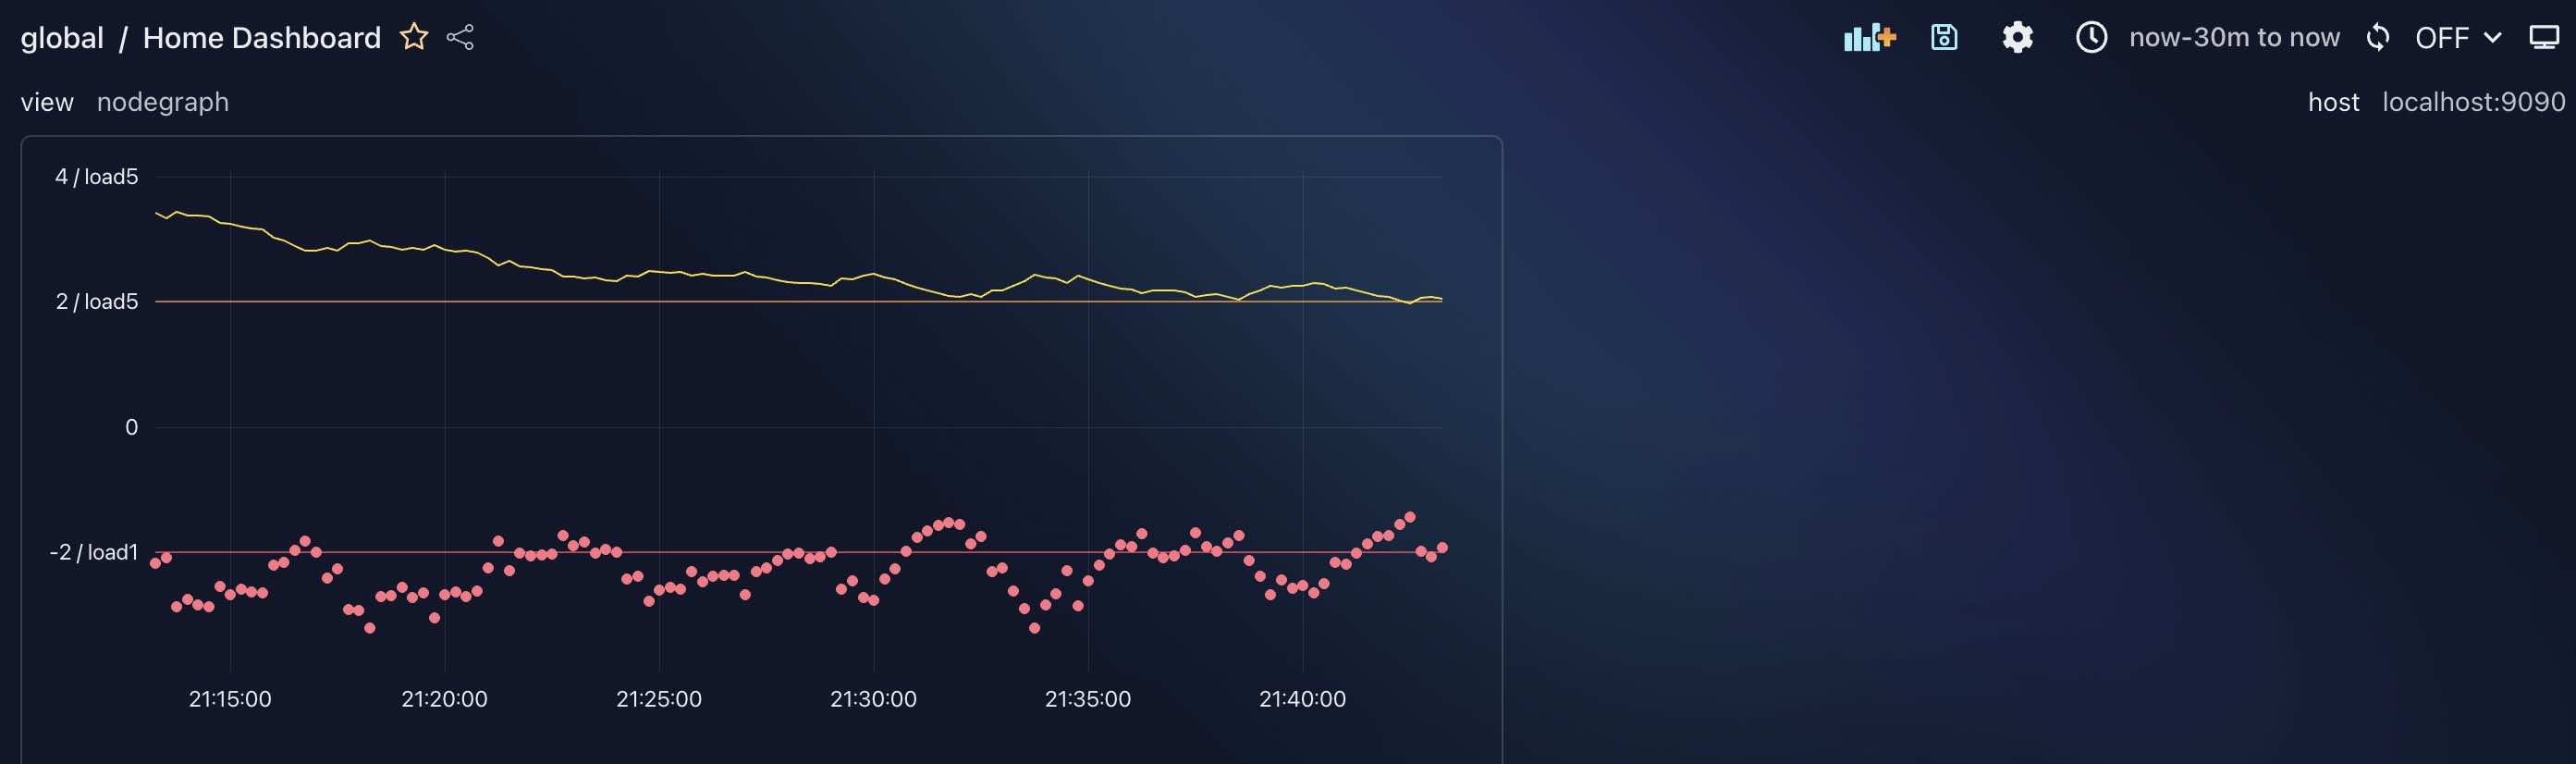
先来看一张点击之前的图片:
下面让我们触发点击事件,然后看看结果如何:
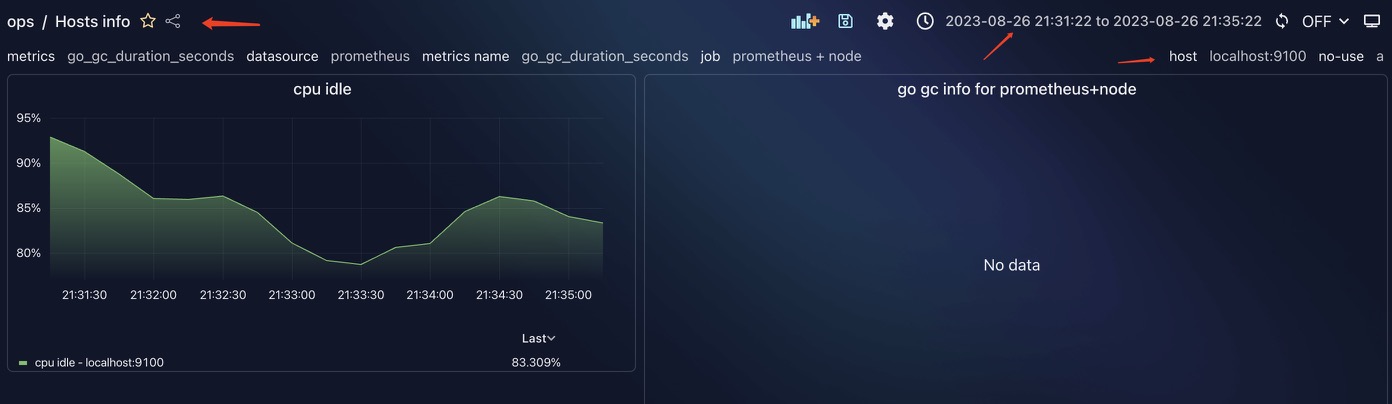
你可以看到图中三处通过箭头标记的地方全部发生了改变,如我们所料,nice!